TX-FUELCOMPASS
Optimize your fuel savings with Big Data analytics
Key Facts
Fueled by DataBig Data analyticsHolistic 360° view on fuel and refueling costsDigital SolutionNo extra hardware needed
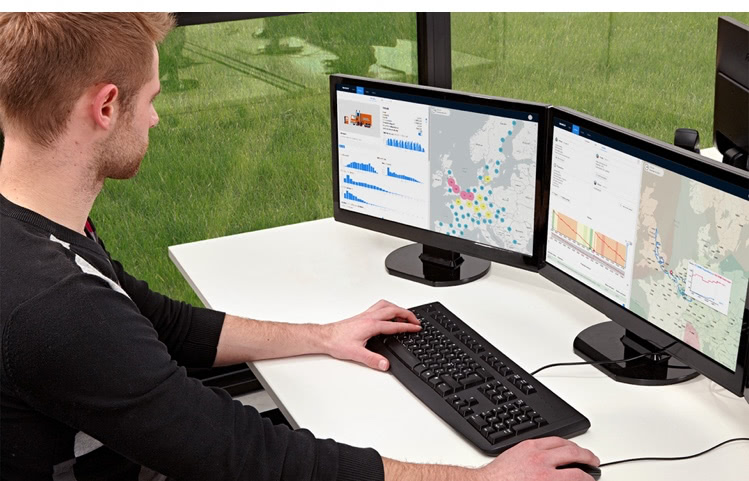
TX-FUELCOMPASS is a software platform that provides a complete view of your fleet’s fuel and refueling costs. The solution accesses huge amounts of data from different sources and brings these “big” data sets together in transparent graphs and dashboard views. Combined with one of our on-board computers, TX-SKY or TX-GO 2, TX-FUELCOMPASS allows you to evaluate and improve your fleet’s refueling behavior without any extra or special hardware investment.
Gallery

Details
Why use TX-FUELCOMPASS
TX-FUELCOMPASS leads to new insights on your fleet’s refueling behavior. Showing cost-inefficient refills from the past and suggesting best case refuel scenarios for the future with an indication of your savings potential, it will help to ensure cost reductions. TX-FUELCOMPASS complements existing consumption reports, driving style analytics or other ECO solutions to maximize your fuel cost savings.
- Assess refueling behavior
- Gain new insights to optimize costs
- Refueling recommendations with savings indication
How to use TX-FUELCOMPASS
The web-based Big Data analytics application consists of five sections: Fleet, Trucks, Drivers, Refueling and Fuel drops. Each module analyzes and visualizes fuel consumption and refueling data from their specific perspective. Combined, these modules offer a 360°-visibility on your fleet’s fuel costs.
- Check current fleet activities
Check your fleet’s current activities and drill down on vehicle group or individual truck level: what is the total distance covered, how much fuel is used, what is the average fuel consumption and how intensely are your vehicles being utilized?
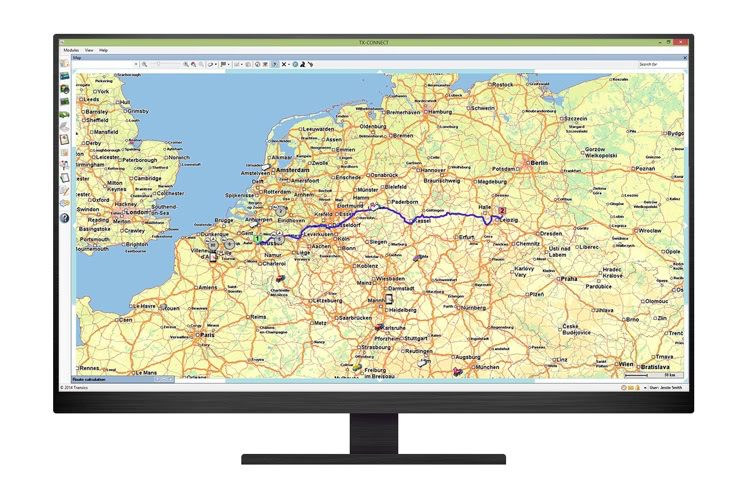
- Observe all refueling transactions
Get a detailed overview of all refueling transactions and pick up specific refueling patterns. By adding context (total itinerary, remaining fuel level, other fuel stations along the route, fuel prices, etc.), the system indicates where and when the vehicle should have refueled to achieve cost savings, compared to the actual refueling.
- Analyze fuel consumption
Look at the fuel consumption of the different vehicles that make up your fleet. Analyze individual vehicle consumption rates and distances. Compare trucks with each other to find out which vehicles are most fuel efficient.
- Compare average driving consumption
Compare individual drivers who are using the same vehicles, to determine their average fuel consumption. Based on how fuel-efficient drivers are performing and the distances they have covered over a certain period, the system not only provides a driver ranking, but also shows the number of liters each driver has wasted or saved compared to his peers.
- Detect fuel drop
Detect any fuel decrease with this last module that specifies a fuel level anomaly with exact drop and remaining fuel level percentages as well as time and location information. Nice graphical overviews and advanced filter possibilities on truck, driver and country level give you full control over how the fuel is used on the road.


